Case Study
AI Support Operations Lab
Designing systems to improve support performance using data and AI
Problem
Support leaders often have visibility into their metrics but lack a clear way to translate those metrics into actionable improvements and predictable outcomes.
As a result, teams struggle to prioritize the right changes, understand trade-offs, and quantify impact.
Solution
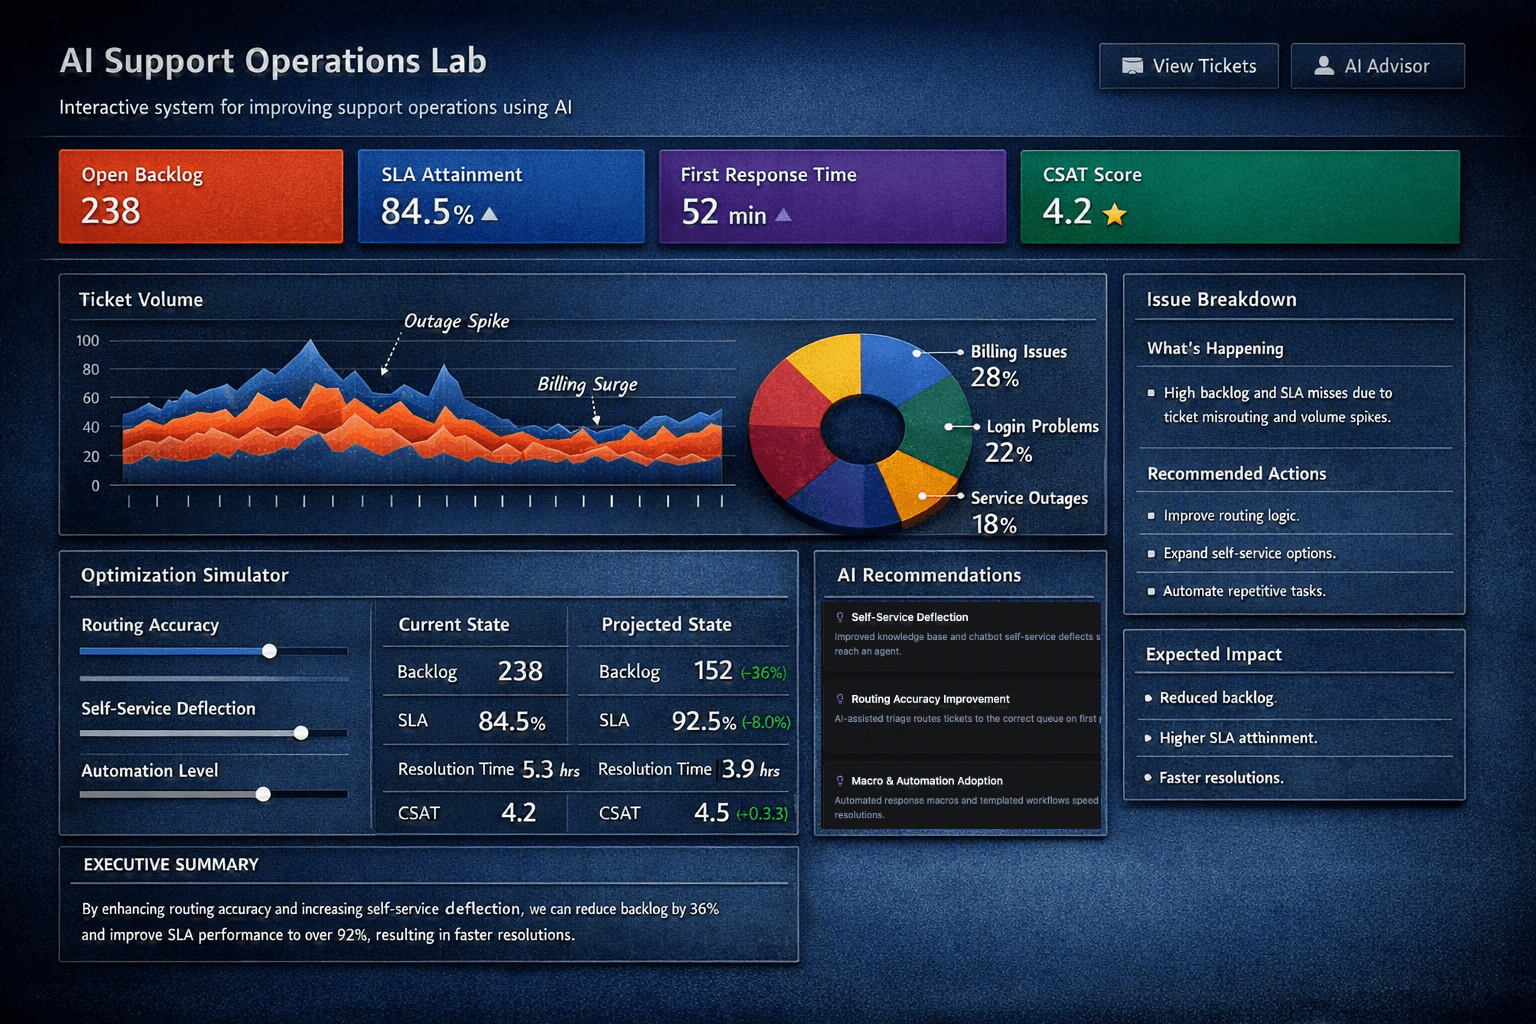
I designed an interactive system that connects support performance data to operational decision-making.
The system allows leaders to:
- analyze performance across key metrics
- identify operational bottlenecks
- simulate improvements
- quantify expected business impact
System Overview
The system is structured around five core components:
- Dashboard — provides a real-time view of operational performance
- Tickets — surfaces root causes through AI-assisted categorization
- Agents — models workload, utilization, and burnout risk
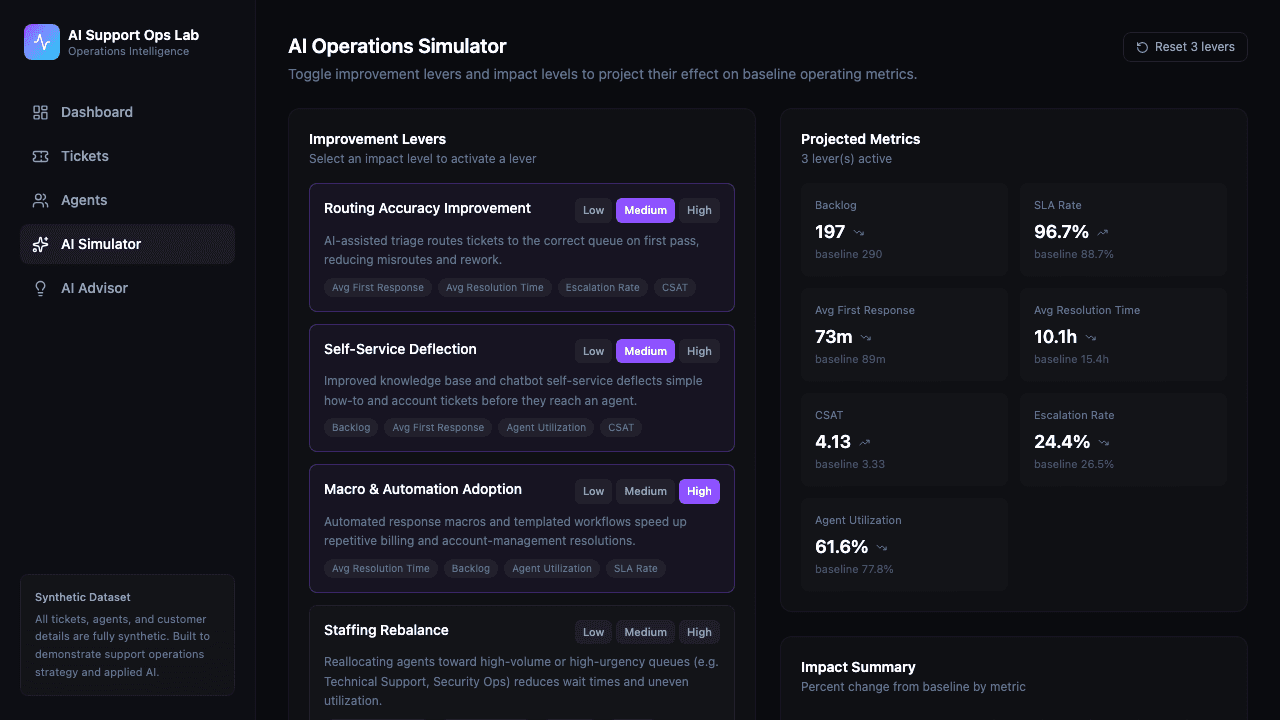
- Simulator — allows leaders to test operational changes
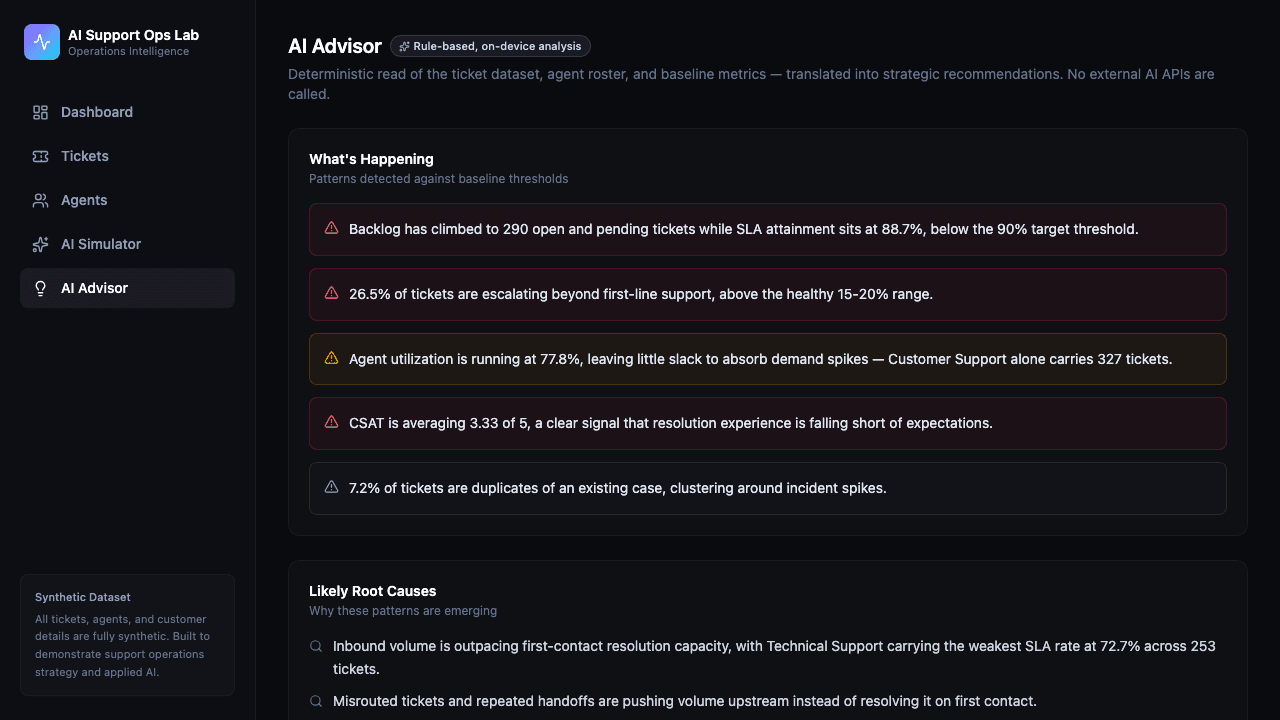
- AI Advisor — translates data into strategic recommendations
Simulation Layer
Rather than simply reporting metrics, the system enables leaders to simulate changes and evaluate outcomes before implementation.
Examples:
- increasing routing accuracy
- expanding self-service
- reducing handoffs
- optimizing staffing
Each change is tied to measurable outcomes such as SLA performance, backlog size, resolution time, and customer satisfaction.
Impact
This system demonstrates how support organizations can:
- move from reactive reporting to proactive decision-making
- prioritize the highest-impact operational improvements
- reduce inefficiencies and cost-to-serve
- improve both customer experience and team performance
Feature Walkthrough
A closer look at each component of the system and the operational insight it surfaces.
Dashboard
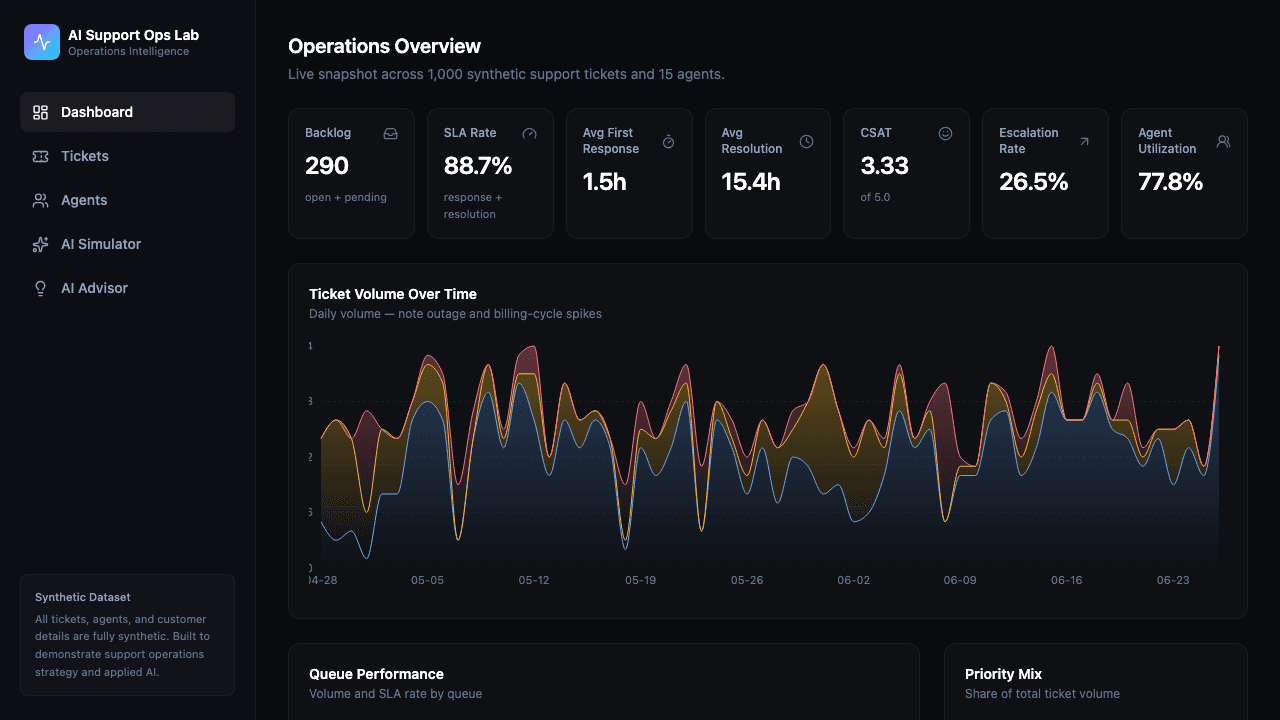
A single pane of glass for operations health
Seven live KPIs computed directly from the ticket dataset — backlog, SLA rate, first response, resolution time, CSAT, escalation rate, and agent utilization. Volume trends surface outage spikes and billing-cycle patterns at a glance, while per-queue SLA and CSAT detail shows exactly where performance is breaking down.
Ticket Explorer
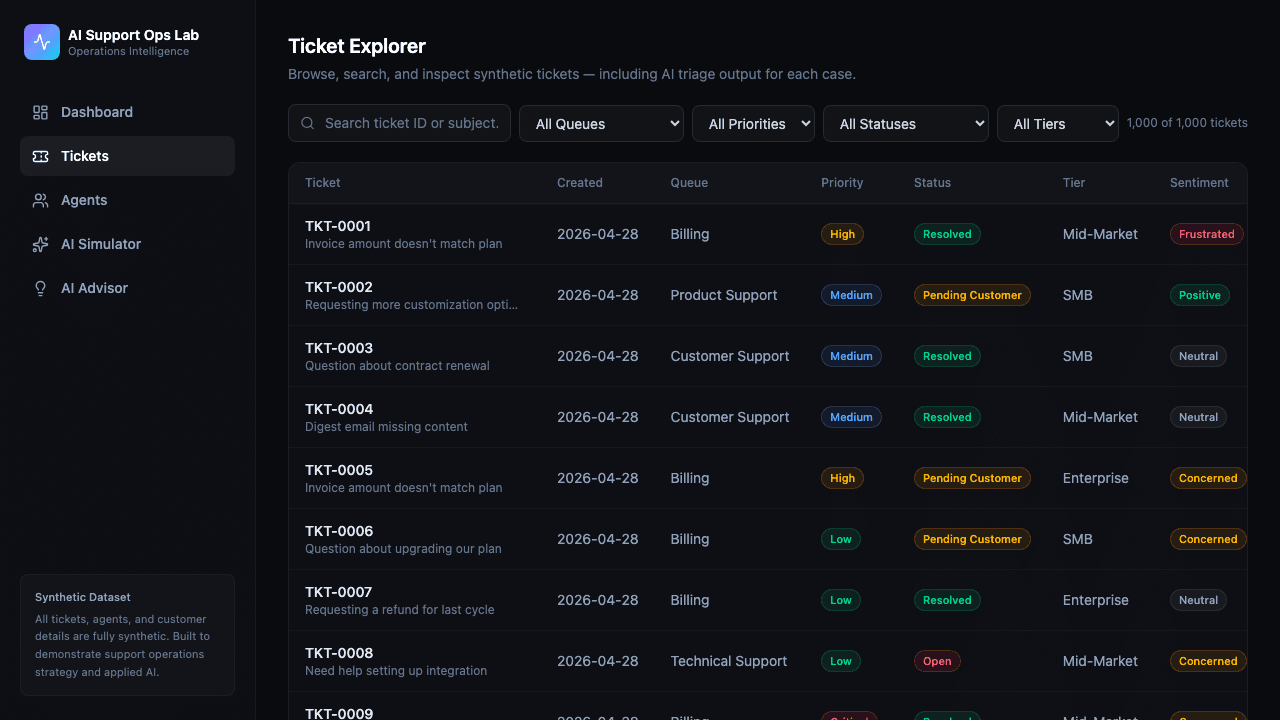
AI triage output surfaced on every case
Search and filter 1,000 synthetic tickets by queue, priority, status, and tier. Click any row to open a detail drawer showing the AI triage summary, recommended vs. actual routing, urgency classification, resolution metadata, and flags like escalation, reopens, and duplicate status — the same signal a triage model would surface in production.
Agent Roster
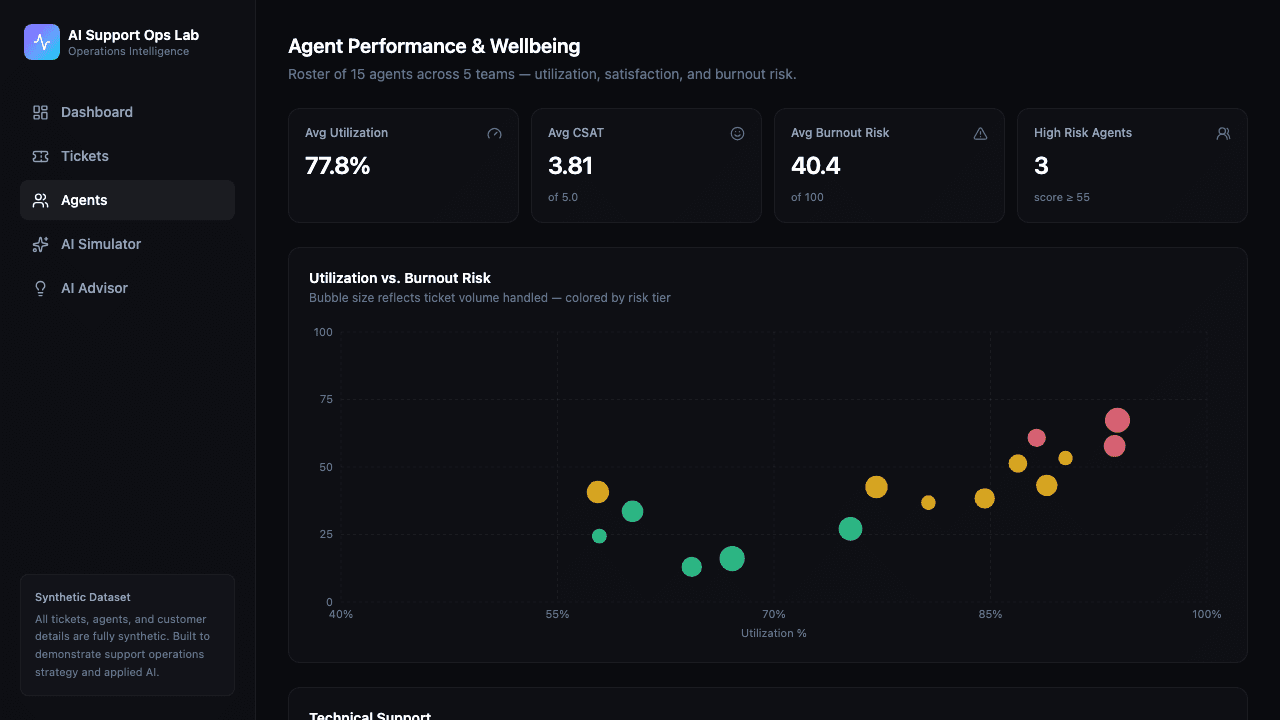
Workload and burnout risk in one view
A scatter chart plots all 15 agents by utilization rate vs. burnout risk, with bubble size reflecting ticket volume. Color coding — green, amber, rose — immediately identifies agents approaching unsustainable workloads before it shows up in CSAT or attrition.
AI Operations Simulator
Test improvements before committing resources
Toggle five improvement levers — routing accuracy, self-service deflection, macro automation, staffing rebalance, and duplicate reduction — at low, medium, or high impact. Projected metrics update instantly and an impact chart shows the percentage change across all seven KPIs, giving leaders a quantified view of trade-offs before any work begins.
AI Advisor
Strategy-ready recommendations from the data
A deterministic rule engine scans the full dataset and produces an executive-ready analysis: what's happening, likely root causes, recommended interventions, projected business impact, and copyable leadership talking points. No external AI APIs — every recommendation traces back to a specific threshold check against the live data.
Tech
Built with React, TypeScript, Tailwind, and Recharts using synthetic support data.